AT319 Lab #6 Raster Analysis in GIS: ESRI Tutorials
- Leighton Moorlach

- Feb 27, 2022
- 2 min read
Overview:
For class this week I engaged in a series of tutorials created by ESRI for ArcPro. These designed to several forms of raster data analysis. I learned how you can use DEMs, DTMs, or DSMs for various forms of analysis such as calculating slope and aspect. Also, I did some other tutorials that show how one can calculate line of sight and viewshed analysis using GIS. As I completed these tutorials, I thought of how I could apply what I learned to both working with UAS data and/or in mission planning with UAS. Or, how these forms of analysis could relate to aviation management and safety.
Deliverables:
A screen shot with labeled caption upon completion of each subsection of the tutorial.
The exported PNG of the final product with this report.
The certificate of the courses at the end of each assignment.
Terrain Analysis using ArcGIS Pro Deliverables

Fig. 1: Set the appropriate analysis environment.

Fig. 2: Ran the slope spatial analysist tool and raised the transparency level of the sd_slope layer.

Fig. 3: Ran Aspect spatial analyst tool and raised the transparency level.

Fig. 4: Ran the Raster Calculator spatial analyst tool and wrote an expression to derive slope and aspect surfaces from an elevation surface and used all three surfaces to perform a binary suitability analysis.

Fig. 5: Results of creating a new hillshade raster function layer.

Fig. 6: Changed the color scheme of Im_elevation and combined the hillshade and elevation surfaces.

Fig. 7: Created contour lines and added visually appealing labels.
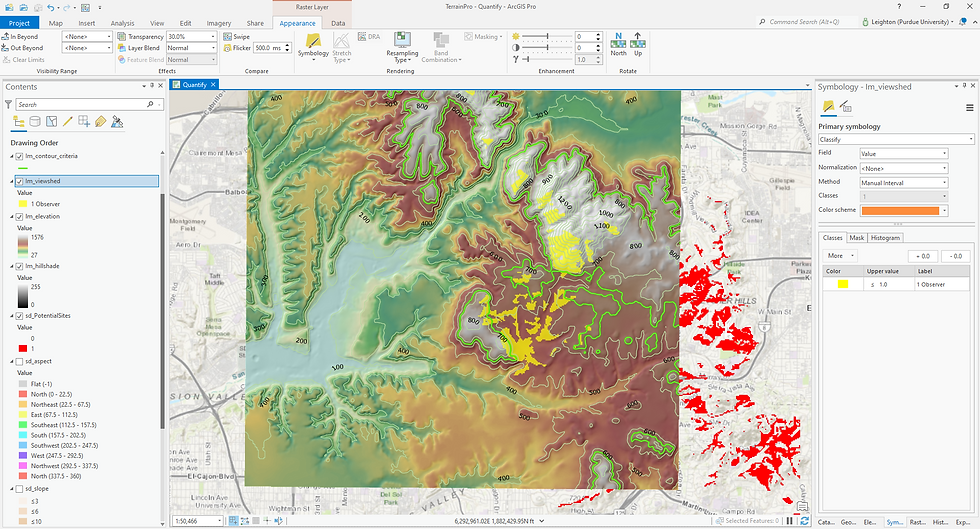
Fig. 8: Ran Viewshed tool to show areas that can be seen from a point in the middle of the reservoir.

Fig. 9: Viewing map in 3D view.

Fig. 10: Certificate of completion for terrain analysis.
Performing Viewshed using ArcGIS Pro Deliverables

Fig. 11: Added VSPro.gdb database to the catalog pane.

Fig. 12: Editing the property boundary symbology then added the rest of the geodatabase feature classes to the map.

Fig. 13: Added additional fields to the attribute table and inserted the required values for each new field.

Fig. 14: Results from running the viewshed (3D analyst tools) tool.

Fig. 15: Results from creating a raster function layer. Results show the area of the campground covered by more than two lights.

Fig. 16: Changed the height of the lights with OFFSETA field values set to 10.

Fig. 17: Ran a new raster function analysis with the new light height. The lighting is much more improved from the previous height.

Fig. 18: Completion certificate for Viewshed Analysis.
Performing Line of Sight using ArcGIS Pro Deliverables

Fig. 19: Opened up project file and added folder connection.

Fig. 20: Results of the Construct Sight Lines tool.

Fig. 21: Results of the Line of Sight tool. Green lines showing unobstructed views of the parade, red lines means buildings are blocking the view.

Fig. 22: Shape Length field added to attribute as a result of running the Add Z Information tool.

Fig. 23: Results from selecting and deleting the obstructed views and views with a maximum visibility of 1,100 feet.

Fig. 24: Results after running the modelbuilder view.

Fig. 25: Certificate of completion for line of sight analysis.


Comments