AT319 Lab #8 Volumetric Analysis with UAS Data
- Leighton Moorlach

- Mar 13, 2022
- 2 min read
Overview
This week I calculated the volume of an aggregate pile that was created during a dredging operation. I utilized several new tools within ArcPro. For this lab I used the Wolfpaving Geodatabase and Litchfield datasets provided to us by our professor Dr. Hupy.
Order of Operations
1. Copy the data to the Temp folder on your C drive.
2. Examine the data in Arc Catalog
3. Create Extraction Clip Feature Class.
4. Perform Extract By Mask
5. Perform Surface Volume Analysis
6. Resample Data to 10cm (just the DSM)*
7. Datasets: Perform Volume on Stock pile for three collection dates
While the data was moving over, I took time to learn about the analysis operations I would be using in the lab.
Extract by Mask: Extracts the cells of a raster that correspond to the areas defined by a mask.
Resample: Changes the spatial resolution of a raster dataset and sets rules for aggregating or interpolating values across the new pixel sizes.
Surface Volume: Calculates the area and volume of the region between a surface and a reference plane.
Calculating volumes of a raster clip
Starting with the Wolfcreek.gdb I created a table below that provides the coordinate system, units of measure, and the GSD.
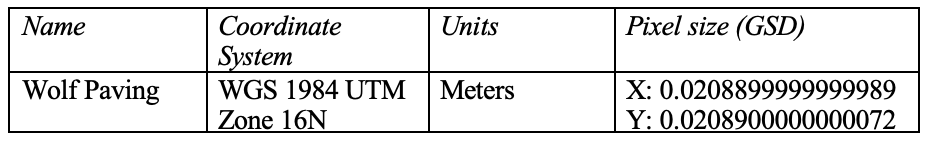
Table 1: The coordinate system, units of measure, and the GSD.
In the geodatabase, I created a polygon feature class. I then used the Extract by Mask toolbox operation to clip out the aggregate piles. I used the surface volume tool to generate the volume for each of the raster clips.

Table 2: The elevation surface and volume of the clip.

Fig. 1: Wolf Creek Paving stock piles volumetric analysis.
Volumetrics using Temporal Datasets
Now that I have worked with a dataset that I am familiar with, I engaged in calculating volumetric data at a mine site that has three very different data sets from three different dates. I added the clippped DSM data sets from the Litchfield database that I used in lab 7.

Table 3: Coordinate System, Pixel Size or Ground Spaced Distance (GSD), Minimum and Maximum height of each DSM.
I resampled the data to 10 cm and 100 cm. Next, I created polygon features for the main stock pile. I already had this clipped, but I needed to eliminate everything but the pile, which means getting rid of the water. I performed the extract by mask and calculated the volume for all the Datasets I extracted.

Table 4: Name of extract and the volume of the 10cm and 100cm dataset.

Fig. 2: Litchfield dredge pile volumetric analysis from July 4th, 2017.

Fig. 3: Litchfield dredge pile volumetric analysis from July 22nd, 2017.

Fig. 4: Litchfield dredge pile volumetric analysis from August 27th, 2017.


Comments