AT309 Lab #3 Pix4D Part 2
- Leighton Moorlach

- Sep 24, 2021
- 2 min read
Updated: Mar 22, 2022
Lab Objectives:
1. Objective #1: Discover, Identify, and implement different methods for 3D model generation using SFM MVS
2. Objective #2: Recognize, relate, and compare different ways imagery can be gathered to construct SFM MVS point clouds.
3. Objective #3: Demonstrate proficiency and knowledge of using Pix4D Mapper and Measure Ground control to gather 3D model imagery.
Overview:
Our team has been assigned to collect data of a shed near the Purdue turf farm. The data collection method has been assigned to us via our instructor. We are expected to use the data to create a 3D model using the Pix4D software.
Deliverables:
Orbit around subject at 30 meters, just above the subject, and at ground level.
Camera angles at: 45, 10, and 0 degrees.
10 degrees between images.
Create Pix4D 3D model.
Field Notes:
Weather conditions: Cloudy, moderate winds, 70 degrees Fahrenheit
Site conditions: Ground wet, civilians in the area.
Potential hazards: High light poles surrounding the subject. Nearby parking with cars nearby. People not a part of the mission nearby. Flock of birds flying in the area.
Mission: Collect data and take pictures of the shed near Purdue turf farm in order to create a 3D model of the subject. Using pix4dcapture and Pix4D to process the data.
Issues encountered: Pix4D capture would not allow me to change the camera angle for the orbit so I had to manually fly the mission. There was also a fence 10 yards from the shed so we had to adjust the diameter of the orbit in order to maintain a safe distance away from the fence when flying at ground level.

Figure 1. Initial processing of the data in Pix4D.

Figure 2. Model after initial processing was complete.
Results:
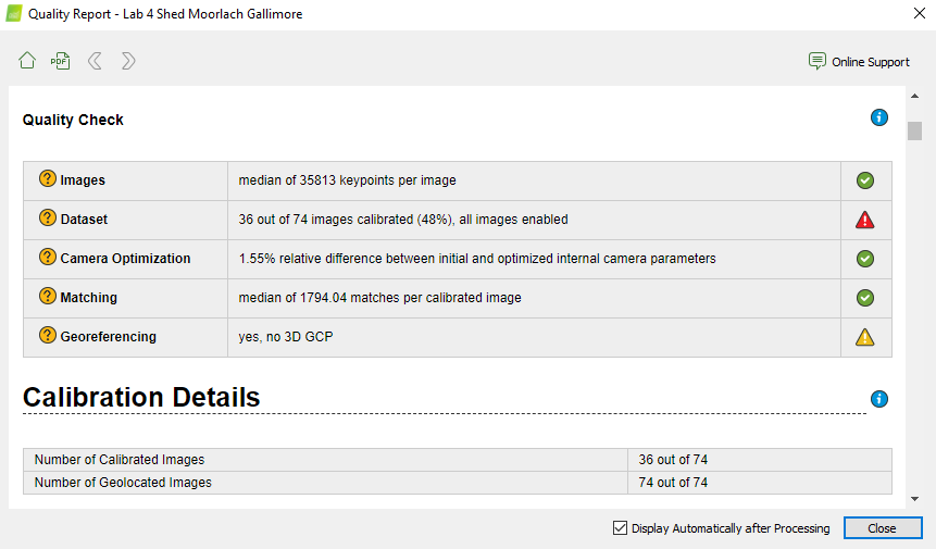
We had a major issue with our model. The quality report told us that only 36 out of the 74 images were calibrated and this gave us a red hazard symbol. When we adding the point ties and triangle meshes not much changed, it almost looked worse. We are disappointed with the outcome of the model but unfortunately pix4d couldn’t calibrate all of the images so our results weren’t the best.

Figure 3. Quality report after the initial processing. Notice the dataset and georeferencing sections.

Figure 4. The explanation of the symbols. Red hazard means failed processing report.

Figure 5. Up close of the shed 3D model. Most of the subject is missing.

Figure 6. Side view of the model. Notice the light poles surrounding the subject.


Comments